Debugging Web Applications
I do most of my work in Firefox. What I'll show you applies to Firefox. There may be analogous tools for other browsers. If so, I don't know anything about them! I can only show you the tools I use and how I use them. My process may not work for you.
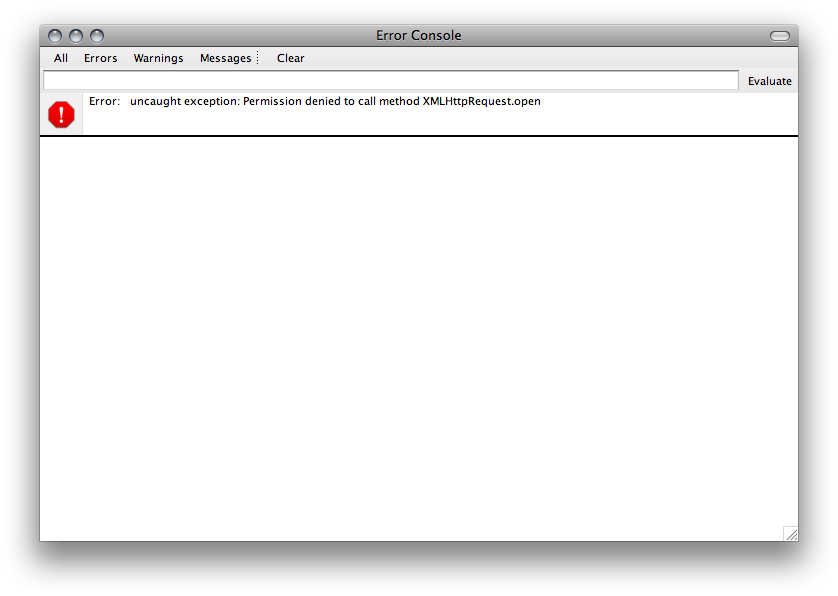
You've already seen the Error Console. You can access it via the Tools menu in Firefox. I use the Error Console as a first line of defense. If something isn't working as I expect it to, I check there first.
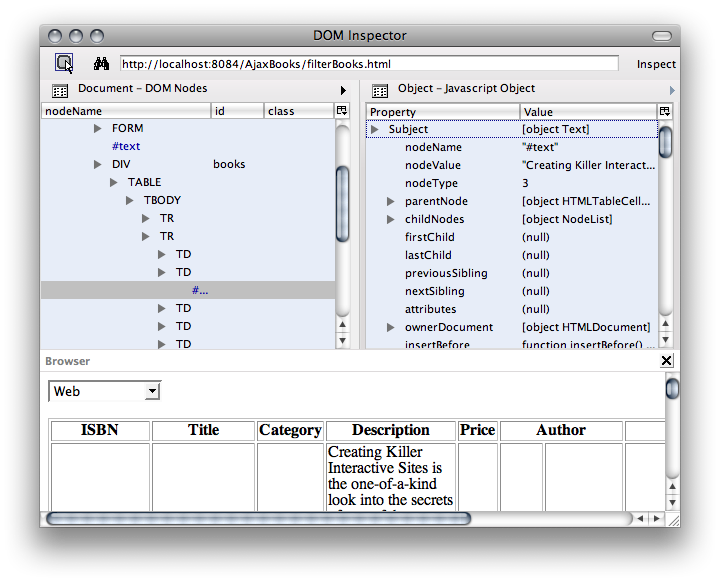
Another tool bundled with Firefox is the DOM Inspector. The DOM Inspector allows you to see web files from the point of view of the parser. It displays the DOM as a hierarchical tree and allows you to inspect the contents of the tree. The cool part is that you can access the DOM tree after you've made an Ajax request and inspect what you get in the response.
Both the Error Console and the DOM Inspector are bundled in the Development Tools package in the Firefox install routine. If you can't see either tool, uninstall Firefox and re-install it choosing Custom Install and including the Development Tools.
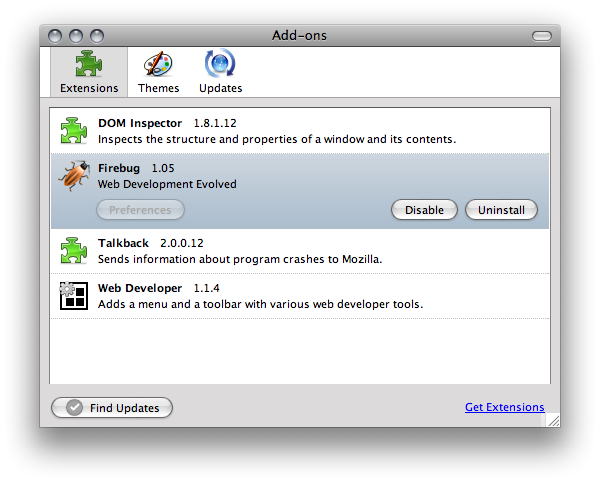
Firefox possesses an add-on feature that allows you to add functionality to Firefox through extensions. Access the Add-ons installed in your copy of Firefox via the Tools menu.
You can view available extensions by clicking on Get Extensions. That will open the Firefox Add-Ons page. Click on the Web Development link to see available development tools.
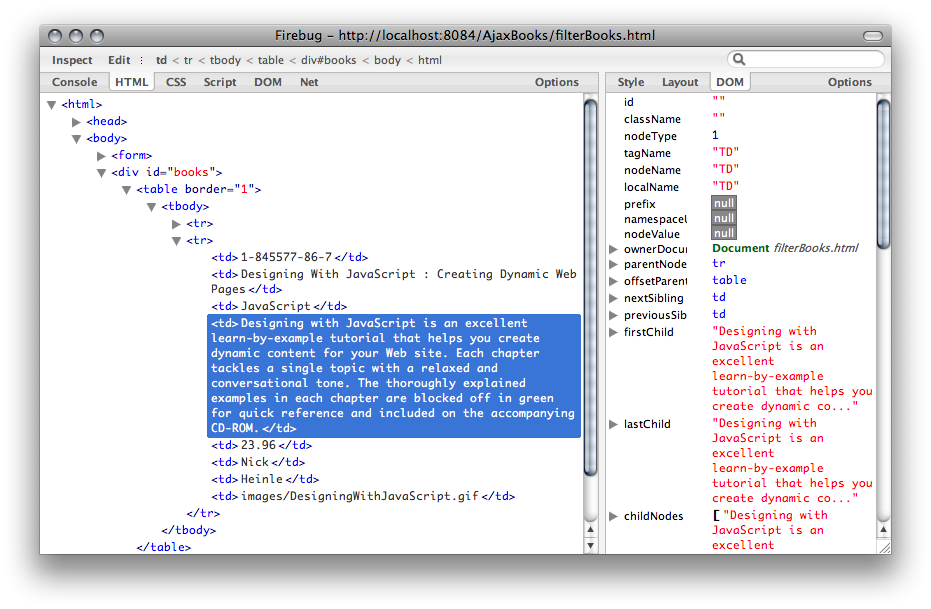
As you can see, I have 2 extensions installed relating to Web Development. Firebug is an advanced Web Application debugging environment. You can open it in a separate window or as a toolbar at the bottom of the browser. More information is available at the Firebug Home Page: http://www.getfirebug.com/.
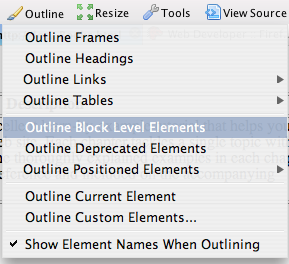
I also use the Web Developer Tool. It installs as a toolbar and menu item under Tools. It allows you to perform various development tasks. The one I use most often is its ability to resize the Firefox window to a specific size. That way, I can see what a given page will look like at 800 by 600 or 1024 by 768 at the click of a button. I also like to use the Outline tool. That shows me visually where each element resides on a page and helps me with laying out pages. More information about the Web Developer add-on is available at the Web Developer Home Page: http://chrispederick.com/work/web-developer/.
Unfortunately, I'm not going to be much help to you other than showing you the available tools. Debugging is a very personal process - everyone does it differently. As I said before, I generally start with the Error Console to detect JavaScript errors. If that doesn't work, I'll poke around inside Firebug. For AJax applications, that's only half the battle. I usually start with the DOM Inspector when I suspect something is wrong with the response. Once again, Firebug is the next step. I find Firebug to be a great tool - but sometimes it is overkill.